
A Deep Dive into Walk-Forward Optimization in Algorithmic Trading
A Python-Based Approach to Combine Williams %R and Aroon Oscillator for Enhanced Performance

The world of algorithmic trading thrives on robust testing and optimization techniques that enhance trading performance while managing risk. One of these methods is walk-forward optimization, a systematic way to test and refine trading strategies over time. We will explore a Python implementation of this technique, integrating 2 indicators: Williams %R and the Aroon Oscillator.
Warning: The returns and results presented are solely based on backtesting using historical data. Although the system has undergone tests to enhance its robustness and resilience to market conditions, there is no guarantee that it will achieve similar profitability in the future. Markets carry inherent risks and volatility. Therefore, you should only invest money that you can afford to lose without causing financial distress.
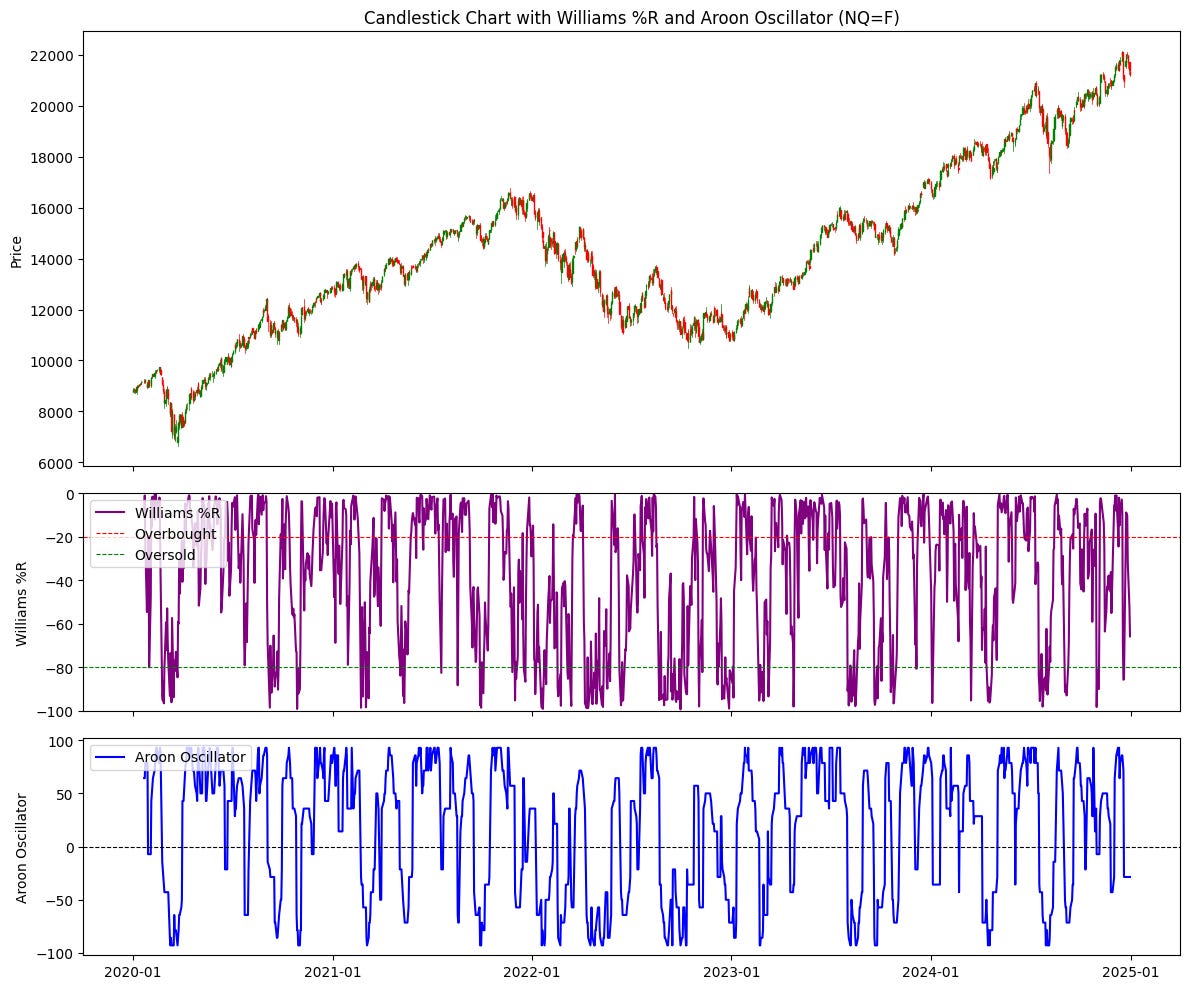
Overview of Williams %R and Aroon Oscillator
Williams %R: A momentum indicator that measures overbought and oversold levels. Values closer to -100 indicate oversold conditions, while those near 0 signal overbought levels.
Aroon Oscillator: An indicator that measures the strength and direction of a trend. Positive values suggest an upward trend, while negative values indicate a downtrend.
These indicators are combined to generate entry and exit signals for a trading strategy.
Implementation: Key Steps
Data Preparation
The strategy begins by importing historical price data using theyfinancelibrary. The dataset includes columns likeOpen,High,Low, and Closewhich are essential for calculating the indicators.Calculation of Indicators
The code implements two functions:calculate_williams_r: Computes Williams %R over a specified period.calculate_aroon: Computes the Aroon Oscillator, indicating trend strength and direction.
Walk-Forward Optimization
This involves:Splitting the data into training and testing sets, with a rolling 4-year training window and a 1-year testing period.
Iterating through parameter combinations for both indicators to find the best-performing pair during the training period.
Applying the best parameters to the testing period and recording the results.
Signal Generation and Backtesting
Entry signals are triggered when Williams %R exceeds -50, and the Aroon Oscillator is positive.
Exit signals are triggered when Williams %R drops below -50, and the Aroon Oscillator turns negative.
Using the
vectorbtlibrary, the strategy is backtested with an initial cash balance of $100,000 and trading fees of 0.1%.
Full Code Here:
import numpy as np
import pandas as pd
import yfinance as yf
import vectorbt as vbt
import itertools

# Function to calculate Williams %R
def calculate_williams_r(data, period=14):
    """
    Calculate Williams %R (Williams Percent Range).
    """
    high_max = data['High'].rolling(window=period).max()
    low_min = data['Low'].rolling(window=period).min()
    williams_r = -100 * (high_max - data['Close']) / (high_max - low_min)
    return williams_r

# Function to calculate Aroon Oscillator
def calculate_aroon(data, period=14):
    """
    Calculate Aroon Oscillator.
    """
    aroon_up = (data['High'].rolling(window=period).apply(lambda x: np.argmax(x) + 1) / period) * 100
    aroon_down = (data['Low'].rolling(window=period).apply(lambda x: np.argmin(x) + 1) / period) * 100
    aroon_oscillator = aroon_up - aroon_down
    return aroon_oscillator

# Walk-forward optimization with Williams %R and Aroon Oscillator
def walk_forward_optimization(df, start_year, end_year):
    results = []

    # Parameter grids for Williams %R and Aroon Oscillator
    williams_periods = range(5, 51)  # Range for Williams %R periods
    aroon_periods = range(5, 51)  # Range for Aroon Oscillator periods

    for test_year in range(start_year + 4, end_year + 1):
        train_start = test_year - 4
        train_end = test_year - 1
        test_start = test_year

        train_data = df[(df.index.year >= train_start) & (df.index.year <= train_end)]
        test_data = df[df.index.year == test_year]

        best_params = None
        best_performance = -np.inf

        # Loop through parameter combinations
        for params in itertools.product(williams_periods, aroon_periods):
            williams_period, aroon_period = params

            # Calculate indicators on the training data
            train_data['Williams_R'] = calculate_williams_r(train_data, period=williams_period)
            train_data['Aroon_Oscillator'] = calculate_aroon(train_data, period=aroon_period)

            # Generate entry and exit signals based on Williams %R and Aroon Oscillator
            entries = (train_data['Williams_R'] > -50) & (train_data['Aroon_Oscillator'] > 0)
            exits = (train_data['Williams_R'] < -50) & (train_data['Aroon_Oscillator'] < 0)

            # Backtest on training data
            portfolio = vbt.Portfolio.from_signals(
                close=train_data['Close'],
                entries=entries,
                exits=exits,
                init_cash=100_000,
                fees=0.001
            )

            performance = portfolio.total_return()
            if performance > best_performance:
                best_performance = performance
                best_params = params

        # Test with the best parameters on the test data
        test_data['Williams_R'] = calculate_williams_r(test_data, period=best_params[0])
        test_data['Aroon_Oscillator'] = calculate_aroon(test_data, period=best_params[1])

        entries = (test_data['Williams_R'] > -50) & (test_data['Aroon_Oscillator'] > 0)
        exits = (test_data['Williams_R'] < -50) & (test_data['Aroon_Oscillator'] < 0)

        portfolio = vbt.Portfolio.from_signals(
            close=test_data['Close'],
            entries=entries,
            exits=exits,
            init_cash=100_000,
            fees=0.001
        )

        results.append({
            'Year': test_year,
            'Best_Params': best_params
        })

    return pd.DataFrame(results)

# Define the stock symbol and time period
symbol = 'NQ=F'
start_date = '2015-01-01'
end_date = '2025-01-01'

# Download the data
df = yf.download(symbol, start=start_date, end=end_date)
df.columns = ['Close', 'High', 'Low', 'Open', 'Volume']
df.ffill(inplace=True)

# Perform walk-forward optimization
results = walk_forward_optimization(df, 2016, 2025)

# Display results
print("\nWalk-Forward Optimization Results:")
print(results)

# Combine entry/exit signals based on the best parameters
combined_entries = pd.Series(False, index=df.index)
combined_exits = pd.Series(False, index=df.index)

for _, row in results.iterrows():
    year = row['Year']
    params = row['Best_Params']
    yearly_data = df[df.index.year == year]

    yearly_data['Williams_R'] = calculate_williams_r(yearly_data, period=params[0])
    yearly_data['Aroon_Oscillator'] = calculate_aroon(yearly_data, period=params[1])

    entries = (yearly_data['Williams_R'] > -50) & (yearly_data['Aroon_Oscillator'] > 0)
    exits = (yearly_data['Williams_R'] < -50) & (yearly_data['Aroon_Oscillator'] < 0)

    combined_entries.loc[entries.index] = entries
    combined_exits.loc[exits.index] = exits

# Filter data for testing period only
df = df[(df.index.year >= 2020) & (df.index.year <= 2025)]
combined_entries = combined_entries[(combined_entries.index.year >= 2020) & (combined_entries.index.year <= 2025)]
combined_exits = combined_exits[(combined_exits.index.year >= 2020) & (combined_exits.index.year <= 2025)]

# Backtest using combined signals
portfolio = vbt.Portfolio.from_signals(
    close=df['Close'],
    entries=combined_entries,
    exits=combined_exits,
    init_cash=100_000,
    fees=0.001
)

# Display performance metrics
print(portfolio.stats())

# Plot equity curve
portfolio.plot().show()
Walk-Forward Results
The optimization process outputs a table showing the best parameters for each testing year and the corresponding performance. The table helps identify parameter trends and consistency across different market conditions.
Walk-Forward Optimization Results:
2020 (20, 7)
2021 (20, 5)
2022 (22, 5)
2023 (20, 11)
2024 (38, 9)
2025 (38, 9)
Example:
2025: williams_period=38, aroon_period=9
If we use this trading system with NASDAQ, these will be the parameters we use this year.
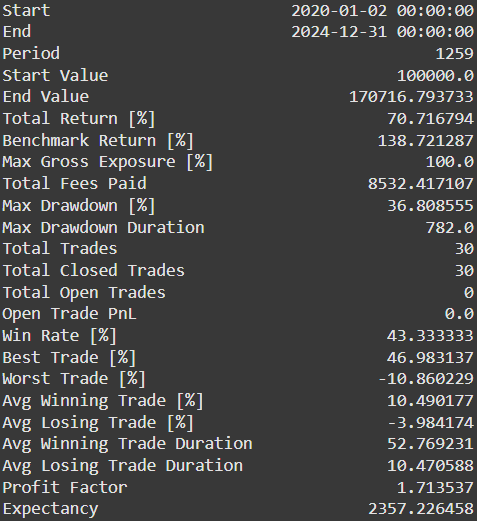
Final Backtest Result
The strategy combines signals from each testing period using the best parameters to evaluate overall performance from 2020 to 2025. Metrics such as total return, Profit Factor, and maximum drawdown are displayed, providing a comprehensive view of the strategy's effectiveness.
Performance Metrics
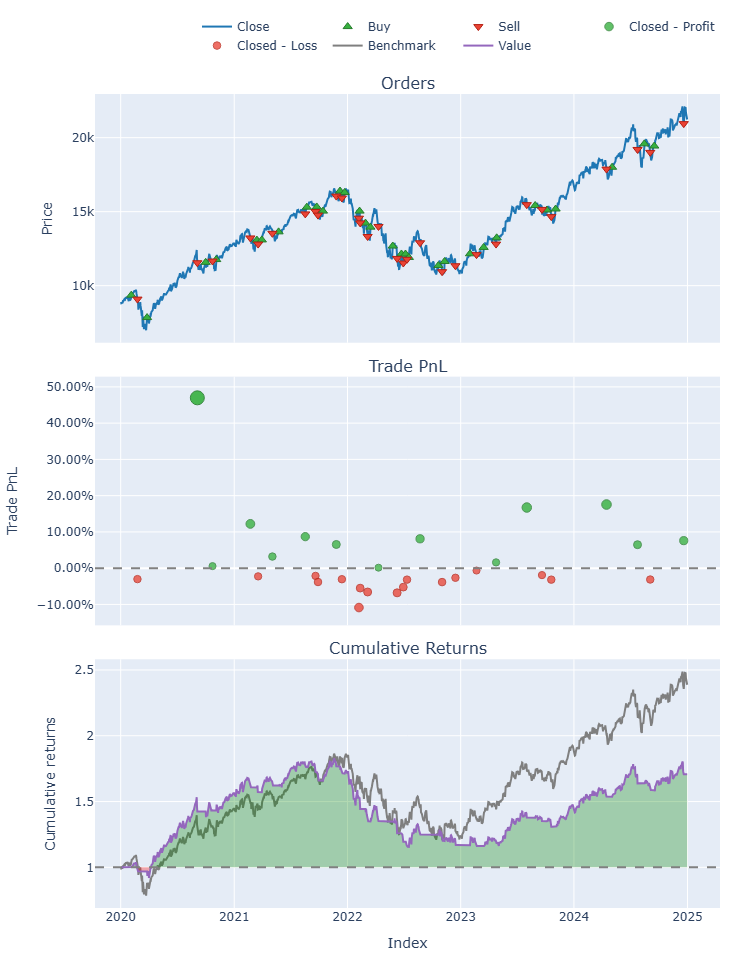
Performance Visualization
Buy and Hold Performance Metrics
# Buy and Hold Performance Metrics
df_holding = df['Close']

# Filter data for the test period (2020-2025)
df_holding = df_holding[(df_holding.index.year >= 2020) & (df_holding.index.year <= 2025)]

pf = vbt.Portfolio.from_holding(df_holding, init_cash=100_000)
pf.stats()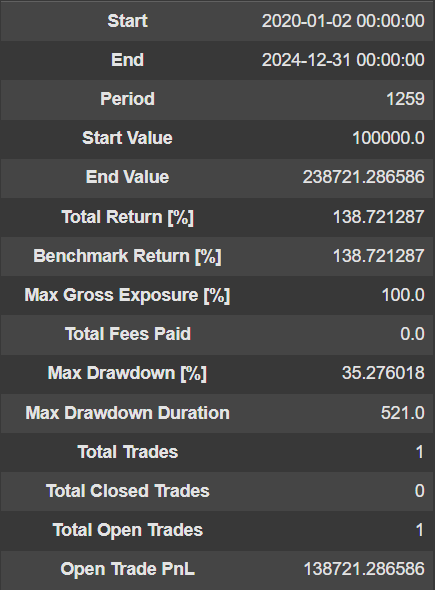
The results from robustness testing show that while this trading system can generate profits, it still underperforms the buy-and-hold strategy. The system achieved a return of 71% with a maximum drawdown of 37%, which is inferior to Buy and Hold in both return and drawdown, at 139% and 35%, respectively.
This indicates that the trading system still requires further development. Observing the losing trades, it is evident that the system struggled significantly during the sideways downtrend in 2022-2023. If we can filter out this period, the system could outperform the market, providing a direction for further improvement.